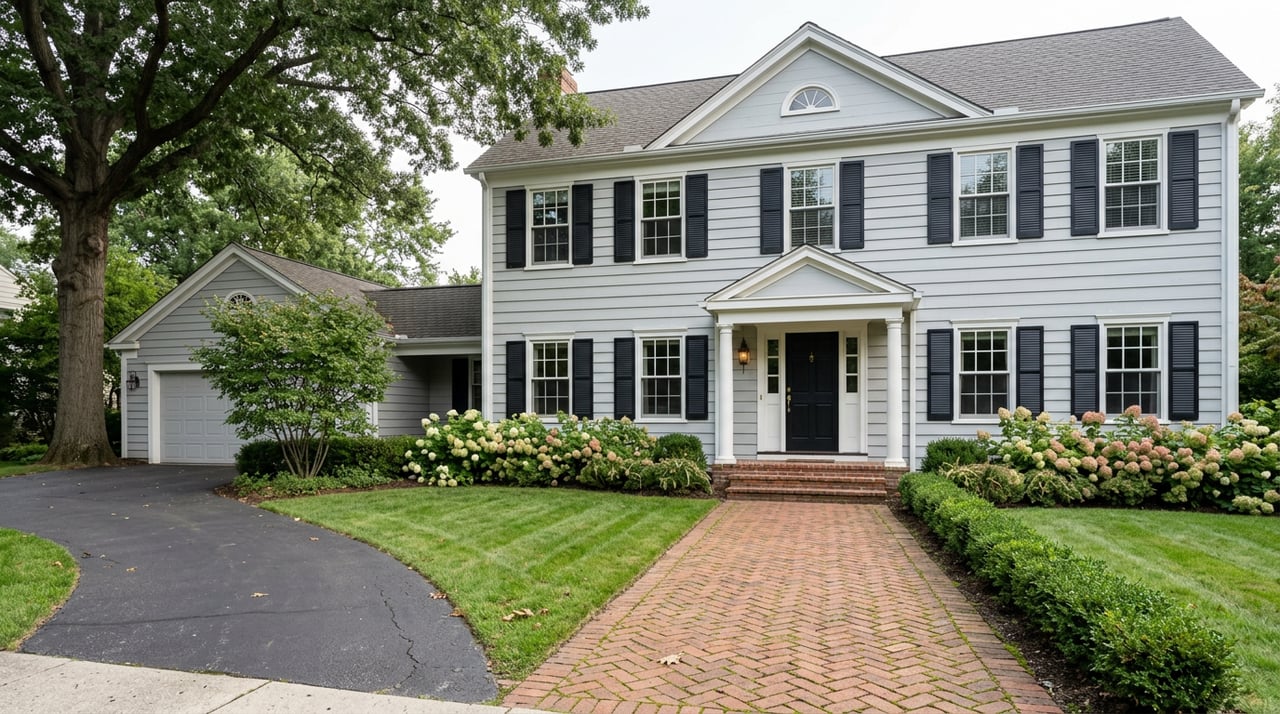
Why Bedford's Home Prices Grew Faster Than Lexington's in July 2026
August 13, 2026
August 13, 2026
If you lined up Bedford, Lexington, and Concord on paper and asked which one should be having the stronger summer, most buyers would guess wrong. Bedford lost its passenger rail service back in 1977. The old Boston & Maine line that once ran through town is now the Minuteman Bikeway, a path for cyclists and dog walkers rather than commuters. Lexington and Concord, by contrast, have the historic town greens, the walkable centers, and the name recognition that usually command a premium in Greater Boston's suburban market.
So it is worth sitting with the fact that in July 2026, Bedford's home prices grew faster than either of them. Not modestly faster. Bedford's average sale price rose 18% year over year and its median sale price rose 29%, according to a market report published in early August by Barrett Sotheby's International Realty covering completed July sales across the region. Lexington and Concord, along with Stoneham, posted lower average sale prices than they had a year earlier. That is not the order most people would predict, and one possible factor to consider is who is signing the paychecks in town.
Here is how the region's July closings compared, based on that same report:
| Town | Average Sale Price, July 2026 vs. July 2025 | Median Sale Price, July 2026 vs. July 2025 |
|---|---|---|
| Bedford | up 18% | up 29% |
| Winchester | up 17% | up 32% |
| Lexington | down year over year | not separately reported |
| Concord | down year over year | not separately reported |
| Stoneham | down year over year | not separately reported |
| Lincoln | another strong month | not separately reported |
| Westford | healthy growth reported | healthy growth reported |
Winchester's strength is easy to explain. It has commuter rail service into Boston, a walkable center, and it has been a consistently sought-after town for years. Bedford's showing is the one that needs unpacking, because none of the usual explanations apply cleanly.
Part of the answer is arithmetic, not sentiment. Bedford's home prices sit below Lexington's on a typical listing, and they have for years. When a market's starting point is lower, the same dollar increase in sale prices produces a larger percentage move. A town with a higher median has to gain more in absolute dollars to register the same percentage jump. This is not a criticism of the data. It is just how percentages behave, and it is the first thing worth checking before treating any month-over-month headline as proof of a shift in buyer preference. A 29% gain from a lower base and a 5% gain from a much higher one can represent similar dollar amounts changing hands.
That said, the base effect alone does not explain why Lexington and Concord actually declined while Bedford surged. If this were purely a math artifact, you would expect Lexington and Concord to grow more slowly, not go negative. Something else is happening underneath the percentages.
Bedford's economy runs on a set of institutions large enough to set their own hiring rhythm, largely independent of the swings that move Boston's finance, biotech, and general tech sectors. Three in particular sit inside town limits or immediately adjacent to it:
That is a combined local workforce in the tens of thousands, funded through federal defense and research budgets rather than venture rounds or quarterly earnings. When Boston-area biotech has a rough funding year or a tech employer announces layoffs, the ripple reaches Lexington and Concord buyers whose household income depends on those sectors. Bedford's buyer pool includes a meaningful share of households whose income is tied to institutions that do not hire and fire on the same calendar. That is not a guarantee against every kind of market softness, but it is one structural difference worth considering when comparing the towns.
If you want to know whether a percentage swing reflects real buyer behavior or just a handful of sales pushing an average around, look at volume, not just price. Bedford's condo segment offers a clean example. The median condo sale price in Bedford rose 40% year over year in July, and more than three times as many condos sold compared to the same month last year. That combination, higher price and much higher volume, is a real signal. It means more buyers actually transacted at higher prices, not that two unusually expensive units happened to close in the same month.
Compare that to Lexington's condo trend for the same period. The report itself flags that Lexington's condo figures are based on just three sales and should be read with caution. Three transactions can swing a percentage wildly in either direction without telling you anything durable about the town's condo market. This is worth internalizing beyond this one report: any time you see a striking percentage change in a market update, ask how many transactions sit behind it. A move built on three sales is a coin flip. A move built on triple the prior year's volume is a market telling you something.
Westford showed a related but distinct pattern, with its typical time to offer on a condo dropping from 40 days to just 4. That is a market moving fast, but it is a different story from Bedford's, where the tell was rising price paired with rising volume rather than compressed timing alone.
None of this means Bedford has overtaken Lexington in price. A single strong month does not erase a price gap that has persisted for years, and this report captures completed sales in July, not the pipeline of homes currently under agreement or freshly listed. What it does tell you is where to look if you are trying to decide between these towns for reasons that go beyond the number on a portal.
If you are comparing Bedford to Lexington or Concord, a few questions matter more than the headline percentage:
These are the questions a monthly aggregate cannot answer for you, and they are exactly the kind of thing worth walking through with someone who tracks these markets month to month rather than glancing at them once.
Does this mean Bedford homes now cost more than Lexington's? No. Percentage growth measures change from a starting point, not the destination. Bedford's typical home price remains below Lexington's even after a strong July. The percentage tells you about momentum, not about which town is more expensive today.
Should I expect Bedford's growth rate to continue at this pace? Treat one month as a data point, not a forecast. The report reflects sales that closed in July 2026, which were likely negotiated weeks or months earlier. A single month, particularly in a market with Bedford's transaction volume, deserves to be watched across a couple more reporting cycles before you treat it as an established trend.
What if I need a clearer read for my specific budget and timeline right now? A town-wide average, no matter how carefully reported, cannot tell you what is happening on your specific street or in your specific price band this week. That requires current comparables and a conversation about your particular situation.
If you are weighing Bedford against Lexington, Concord, or Winchester for your next move and want to look past the headline percentages to what is actually happening in your price range, Martha Sevigny can walk through the current inventory and recent comparables with you. Schedule a confidential consultation to get a read on the market that goes beyond a single month's report.
Stay up to date on the latest real estate trends.





Her skills in finance, attention to detail, and client satisfaction translate seamlessly to the benefit of her real estate clients.